
Adding Application Insight Based Monitoring to Fast API
Application Insights is Azure’s logging and monitoring service, but how do you use it with Fast API? In this blog post, we will explore how to send logs and traces to Application Insights. Finally, we will show you how to integrate this into your Fast API application using custom Middleware. Join us while we explore how to implement this using the opencensus library.
How to use the opencensus library
In this blog post, we will use the opencensus library to send logs to Application Insights. The opencensus library is the swiss army knife for monitoring, and it contains many exporters for a wide variety of monitoring services. And as luck would have it, it also contains an exporter for Application Insights. In Fast API applications, you typically have two types of logs. The first type of log is a regular log event. A typical example of this type is when a system starts up, the occurrence of an exception, etc. The second type is a request log. Request logs differ from regular logs since they have a response duration and a success status. Before adding both approaches to our Fast API application, let’s first explore how to use opencensus to send both types of logs to Application Insights.
How to send regular logs to Application Insights
Python has a build in logging library for logging events.
By default, this logging library sends its logs to the console, but you can easily configure it to send its logs to another location.
All you need to do is add a different handler to your logger.
In our case, opencensus has already implemented such a handler for Application Insights. So all we need to do is add an AzureLogHandler to our logger.
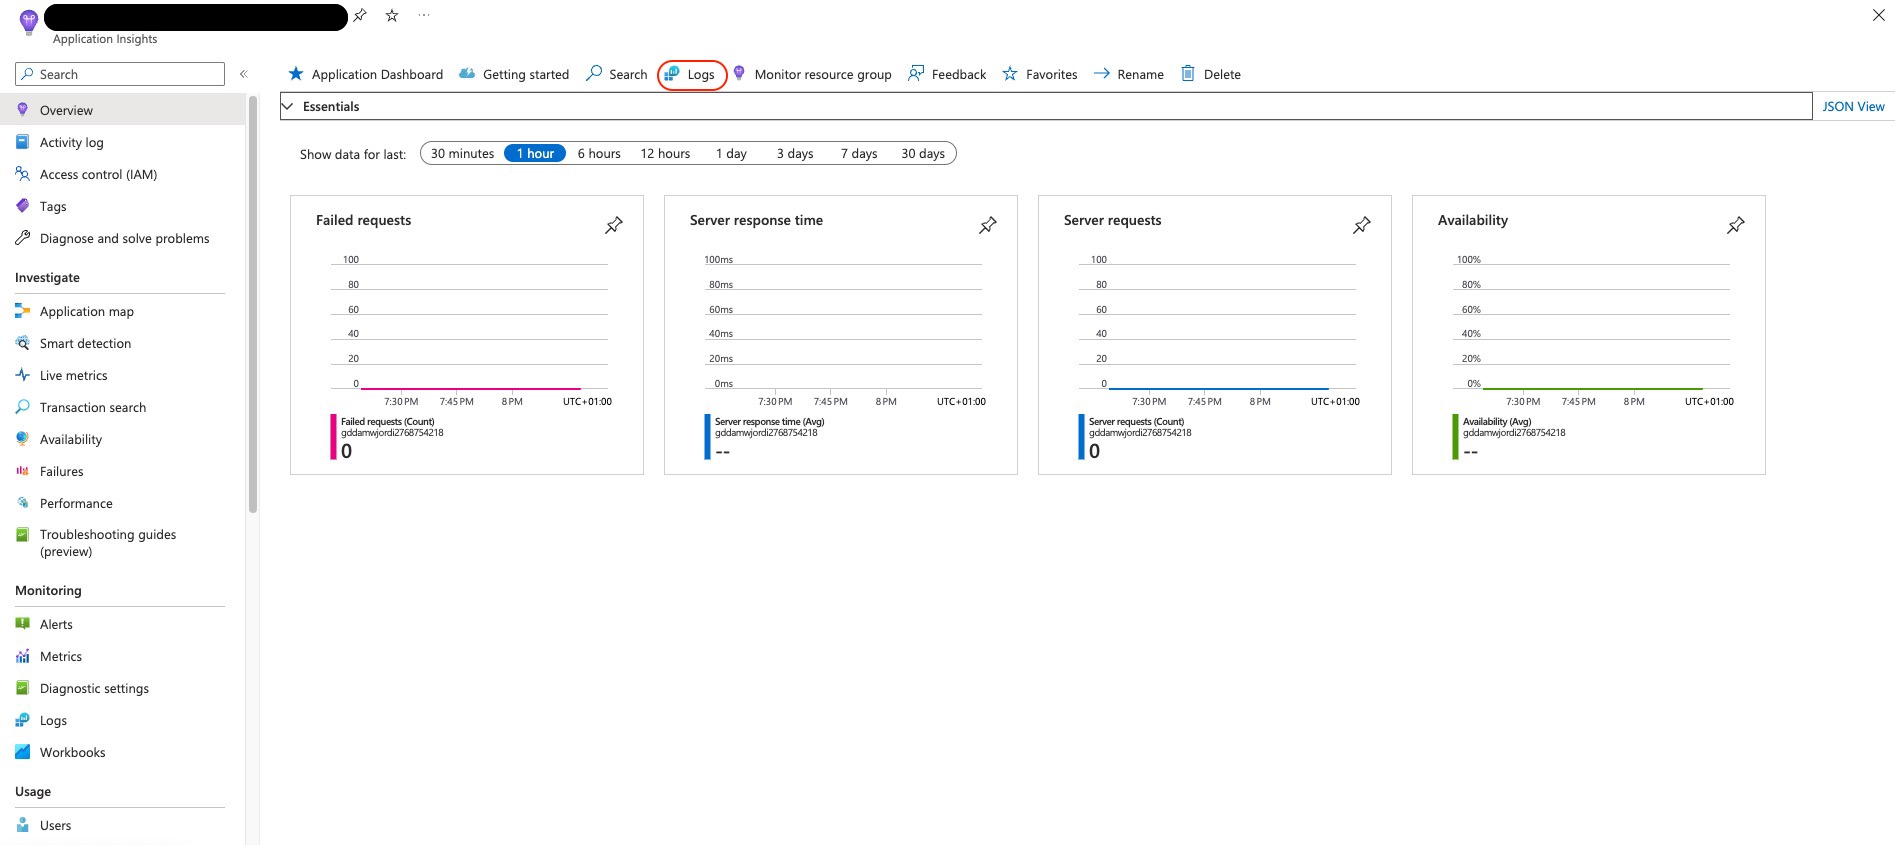
This handler does need a InstrumentationKey, which is Application Insight’s version of an API key. You can obtain your InstrumentationKey by going to your Application Insights resource in the Azure portal.
You can find it on the main page of your resource under essentials.
Once you have the connection string, you can add the AzureLogHandler to your logger as follows:
import logging
import os

from opencensus.ext.azure.log_exporter import AzureLogHandler

# Configure basic logging
logging.basicConfig(format="%(message)s")
logger = logging.getLogger(__name__)
logger.setLevel(logging.INFO)

# Get instrumentation key from environment variable.
instrumentation_key = os.environ["INSTRUMENTATION_KEY"]
# add Azure (Application Insight) log handler to the logger
logger.addHandler(
    AzureLogHandler(connection_string=f"InstrumentationKey={instrumentation_key}")
)
# Log a simple message
logger.info("hello world")
After running the above code, all your logs will be sent to Application Insights.
To find them, you must first go to the Application Insights resource in the Azure portal.
Then, you must click on the Logs tab.
Click on the logs button.
Finally, click on the Click on the traces button in the left menu.traces submenu to see your logs: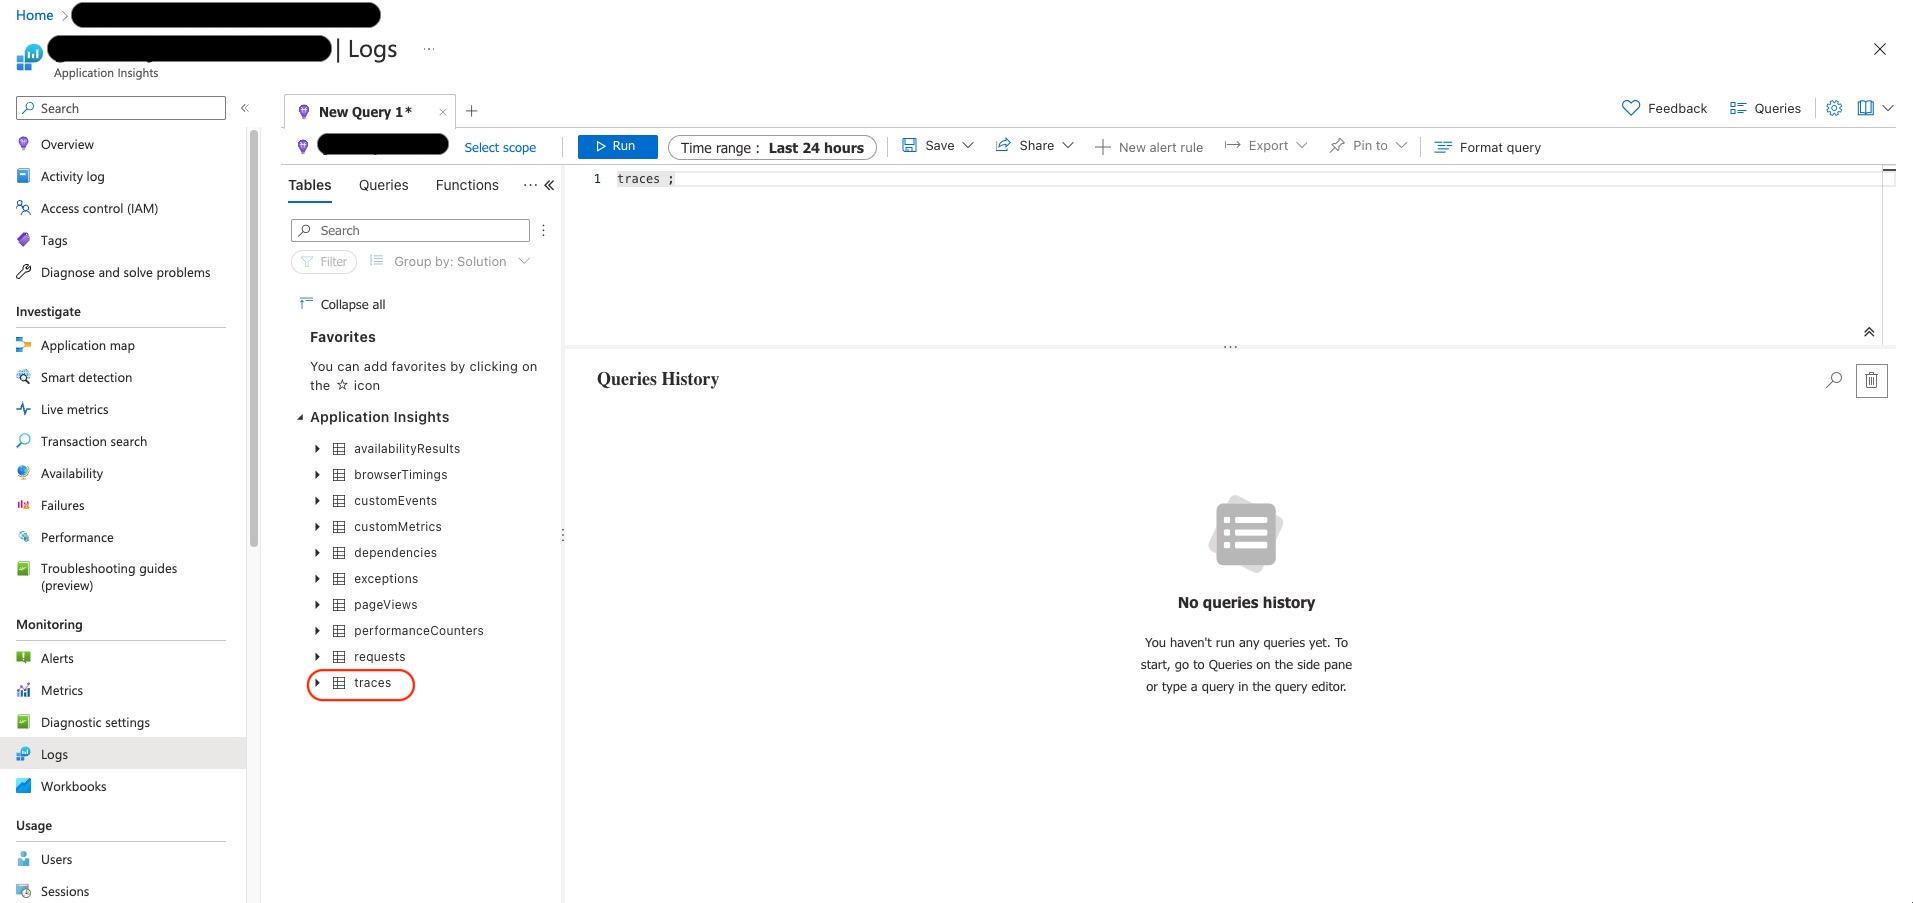
Another nice feature of the AzureLogHandler is that it also supports logging custom properties.
All you need to do is add a dictionary with data to the extra parameter when you log a message.
This feature is helpful if you want to include additional information, such as the current deployment name, the deployed version, etc.
For example:
# Define custom properties for the log message
properties = {
    "custom_dimensions": {"key_1": "some value", "key_n": "something else"}
}
# Log a message with custom properties
logger.info("hello world", extra=properties)
After running the above code, you will see the custom properties are logged in the customDimensions field of the log:
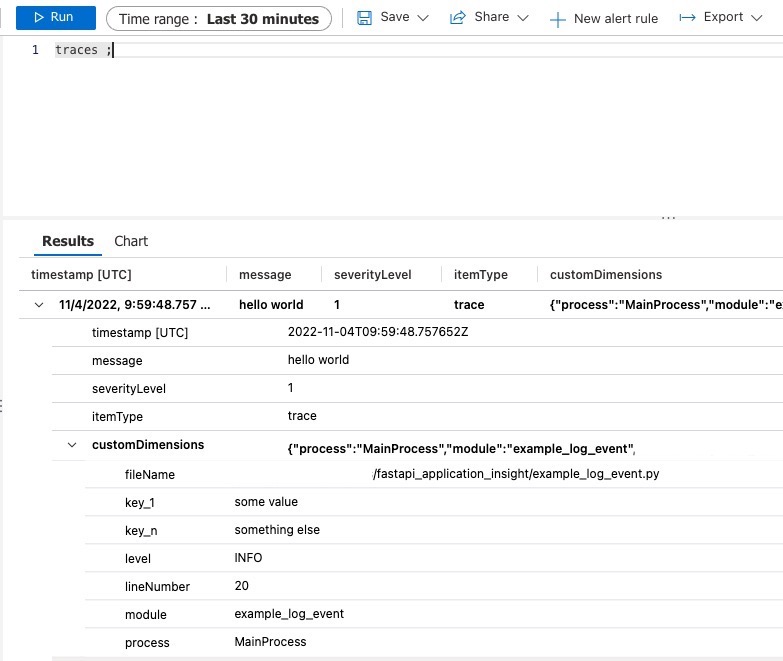
The resulting log in Application Insights.
How to send request traces to Application Insights
In web applications, we are also interested in which endpoints are called, their response code. and how long they needed to process a request.
In theory, you could implement this yourself using try-catch blocks, the time library and the extra parameter of the logger class.
However, this is a lot of work and error-prone if you have to do this often.
Luckily, the opencensus library has a Tracer class that can all of this for you.
It works as follows:
- You receive a request.
- You create a
Tracerand aSpan. - You store all the metadata of the request the
Spanlike the name of the endpoint, the response code, etc. - You start the
Span. - You handle the request.
- You store the response code in the
Span. - You end the
Span. - You send the response.
After you have done this, the Tracer will send the Span as a log to Application Insights with the duration and all other metadata as properties.
Setting this up requires a bit more boilerplate code than logging an event, but it is still far less than doing this all from scratch:
import os
import random
import time

from opencensus.ext.azure.trace_exporter import AzureExporter
from opencensus.trace.samplers import ProbabilitySampler
from opencensus.trace.span import SpanKind
from opencensus.trace.tracer import Tracer

# setup
sample_probability = 1.0
instrumentation_key = os.environ["INSTRUMENTATION_KEY"]
connection_string = f"InstrumentationKey={instrumentation_key}"
# The AzureExporter sends the logs to Application Insights
exporter = AzureExporter(connection_string=connection_string)
# The tracer is responsible for tracking the durations and metadata of the events
tracer = Tracer(sampler=ProbabilitySampler(sample_probability), exporter=exporter)

# start the measurement
span = tracer.start_span("your_log_name")
span.span_kind = SpanKind.SERVER # This tell Application Insights that this is a request log
span.add_attribute("some_extra_data", "some_value") # Add additional data like the extra properties of a regular log

# do something...
# We add a bit of randomness to have some variation in the duration of the event
time.sleep(random.uniform(0, 1))

# add additional data
span.add_attribute("some_extra_data", "after_run_data")

# end the measurement
tracer.end_span()
tracer.finish()
After running the above code a few times, you will see the following types of logs in Application Insights. You see that Application Insights has automatically added the duration of the event and its performance bucket as properties.
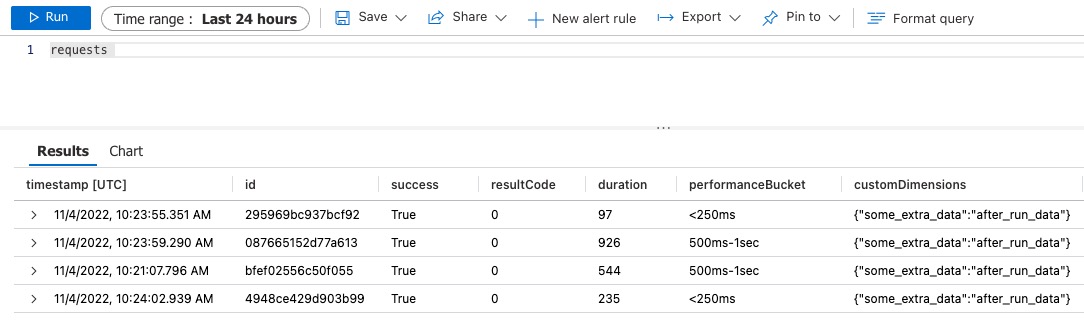
The resulting logs in Application Insights. You can find them under requests.
Putting it all together
We know how to log events and traces to Application Insights, lets add them to our FastAPI application.
Sending our regular logs to Application Insights is relatively straightforward.
All we need to do is add an AzureLogHandler to our logger.
Adding the request traces is a bit more complicated, but we can do it using custom middleware.
This middleware will be called for every request and will start a Span before the request is handled and end the Span just before the response is sent.
Using this approach, we get the following:
import logging
import os
import random
import time
import traceback
from typing import Awaitable, Callable

from fastapi import FastAPI, Request, Response
from opencensus.ext.azure.log_exporter import AzureLogHandler
from opencensus.ext.azure.trace_exporter import AzureExporter
from opencensus.trace.samplers import AlwaysOnSampler
from opencensus.trace.span import SpanKind
from opencensus.trace.tracer import Tracer
from starlette.responses import StreamingResponse

# Setup the event logger
logging.basicConfig(format="%(message)s")
logger = logging.getLogger(__name__)
logger.setLevel(logging.INFO)
instrumentation_key = os.environ["INSTRUMENTATION_KEY"]
connection_string = f"InstrumentationKey={instrumentation_key}"
logger.addHandler(AzureLogHandler(connection_string=connection_string))


# Implement the custom middleware responsible for logging the request traces
class TracingMiddleware:
    def __init__(self) -> None:
        self.sampler = AlwaysOnSampler()
        instrumentation_key = os.environ["INSTRUMENTATION_KEY"]
        connection_string = f"InstrumentationKey={instrumentation_key}"
        self.exporter = AzureExporter(connection_string=connection_string)

    async def __call__(
            self,
            request: Request,
            call_next: Callable[[Request], Awaitable[StreamingResponse]],
    ) -> Response:
        tracer = Tracer(exporter=self.exporter, sampler=self.sampler)
        # create span
        span = tracer.start_span(f"[{request.method}]{request.method}")
        # This tells Azure's application insight that this log is a request.
        span.span_kind = SpanKind.SERVER
        # Add Default url information.
        span.add_attribute("http.host", request.url.hostname)
        span.add_attribute("http.method", request.method)
        span.add_attribute("http.path", request.url.path)
        span.add_attribute("http.url", str(request.url))
        span.add_attribute("http.rout", request.url.path)
        # Add application specific information.
        span.add_attribute("deployment_name", os.environ.get("deployment_name", ""))
        try:
            response = await call_next(request)
            span.add_attribute("http.status_code", response.status_code)
            tracer.end_span()
            tracer.finish()
            return response
        except Exception as e:
            # Add exception info to the log.
            span.add_attribute("error.name", e.__class__.__name__)
            span.add_attribute("error.message", str(e))
            span.add_attribute("stacktrace", "\n".join(traceback.format_tb(e.__traceback__)))
            span.add_attribute("http.status_code", 500)
            tracer.end_span()
            tracer.finish()
            raise e

try:
    app = FastAPI()
    # Add the tracing middleware
    app.middleware("http")(TracingMiddleware())

    @app.get("/")
    def index():
        time.sleep(random.uniform(0, 1))
        return {"hello": "world"}

    logger.info(f"Server is ready")

except Exception as e:
    logger.exception(f"Exception={e}")
    raise e
Conclusion
That’s it, we now have a FastAPI application that logs events and traces to Application Insights. When I first did this, I was confused by the documentation and the lack of examples. So, I hope this post will make it easier for you to start with Application Insight-based monitoring. If some things are still unclear, feel free to reach out.